As part of our IoT development work, MCCI and NY Passive House have been partnering to reduce the cost of monitoring buildings (both high performance buildings and conventional construction). This low-cost study identified eight-fold differences in energy intensity across a variety of buildings. By choosing buildings at the same altitude and in the same microclimate, we are able to focus on differences in construction.
We started monitoring electricity use and temperature a few years ago, using MCCI’s Model 4811 remote power meter with LoRaWAN® technology. This meter allows us to retrofit existing buildings with high-accuracy real-time power monitoring, without requiring Wi-Fi, cellular, or wired connections. We combined that with MCCI’s Model 4822 and 4832 indoor and outdoor environmental sensor.
The data we got was pretty comprehensive for the Passive House buildings, because they only used electricity. But we wanted to compare to more conventional buildings in the same micro-climate and ecotome. For that, we needed cost-effective ways of monitoring fuel oil and propane consumption. MCCI’s engineers responded with two new products, now in test in several buildings around Ithaca, NY.
- The MCCI Model 4861 Propane/Natural Gas meter combines an MCCI Catena® 4612 or 4801 LoRaWAN sensor with low-cost meter with pulse output.
- The MCCI Model 4871 Fuel Oil meter combines a 4612 or 4801 with a high quality fuel oil flow meter. (Not all flow meters are alike, and we want to be sure not to damage the boilers at our study sites. There are a lot of counterfeit flow meters of unknown quality on the market. After some research, MCCI selected high quality meters from Aichi Tokei in Japan, and sourced them directly from the factory.)
We run the data through our normal server (our open-source “Docker IoT Dashboard“, using a Node-RED / InfluxDB / Grafana pipeline). We installed in early February and were immediately getting interesting data. Installation was done by our local HVAC team, Hubbard Heating and Plumbing; MCCI provided diagrams, and Hubbard did the rest. It took between one and two hours per installation. The cost per meter was about $300 for equipment. To simplify installation, all meters use primary batteries only; part of the study is to determine battery life, but we are estimating one to two years, transmitting data every six minutes. We’re using The Things Network in Tompkins County, NY; so we didn’t have to set up a network and data charges are not a factor.
We instrumented seven sites; three Passive House certified buildings “Unit 1” through “Unit 3”, and four comparables “Comp 1” through “Comp 4”. (We also have a “Comp 1”, but for logistical reasons we’ve not added full energy capture there yet.)
- Unit 1 and Unit 2 are twin Passive Houses, built to the same floor plan: two-story 1,440 sq ft detached houses with solar PV systems on the roof and solar hot water.
- Unit 3 is a two-story 1,088 sq ft Passive House, but it’s a row house, without solar PV system.
- Comp 1 is a 2000-sq-ft two-story house with basement, built in 2002. It has forced-air central heat powered by natural gas. Hot water and cooking are also natural gas.
- Comp 2 is a 1900-sq-ft farmhouse, built in 1847. It has a low-pressure steam heat system fired by fuel oil. Propane is used for hot water, cooking, and a clothes dryer. Windows are 30 years old.
- Comp 3 is a 1200-sq-ft bungalow, built in 1970. It has forced-air central heat fired by propane; propane is also used for hot water, cooking and a clothes dryer. Windows are of varying age. Minimal insulation.
- Comp 4 is a 5900 sq-ft commercial building. It is an older farmhouse with two stories plus large finished basement. It was renovated and reconstructed in 2008. It’s not insulated to Passive House standards, but is reasonably tight. It has zoned hot-water baseboards, with a boiler fired by fuel oil. Hot water also is provided by the boiler. Only limited cooking is done at the facility, and there’s no propane.
Fuel Oil Raw Data
Let’s start with the raw data. Here’s seven hours of fuel use at Comp 2:
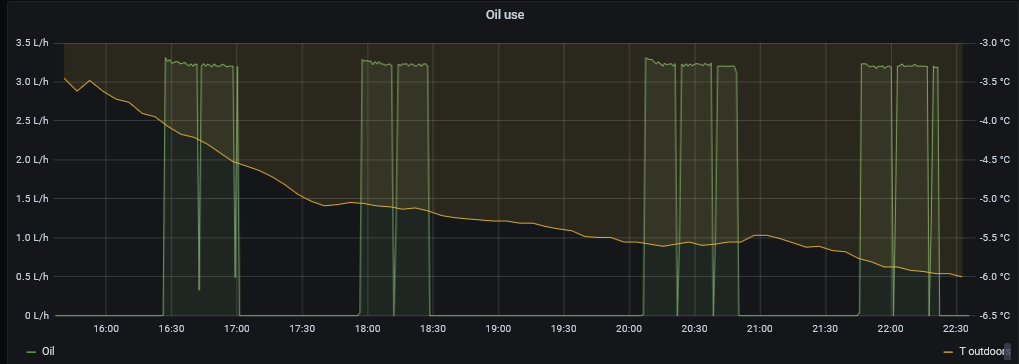
It can be pretty cold in Ithaca in February; the temperature didn’t get above freezing all day. This is all data from Feb 4, 2021.
As you can see, the control system runs the pump for about 15 minutes, pauses it for maybe 5 minutes, and then runs for another 15 minutes. Remeber, this is a low-pressure steam boiler; when the burner comes on, it has to run for a while to start driving steam into the pipes.
You can also see a repeatable pattern: the pump pushes a little more oil at the start of a burn cycle than at the end. We’re not sure why that is, fuel oil pumps are supposed to push at a constant rate. This is exactly why we wanted to see “actual fuel burn” rather than “pump-on time”.
Let’s look at “Comp 4” next. It has a baseboard hot-water system (not steam) and the operating pattern is completely different. Same time scale as above.
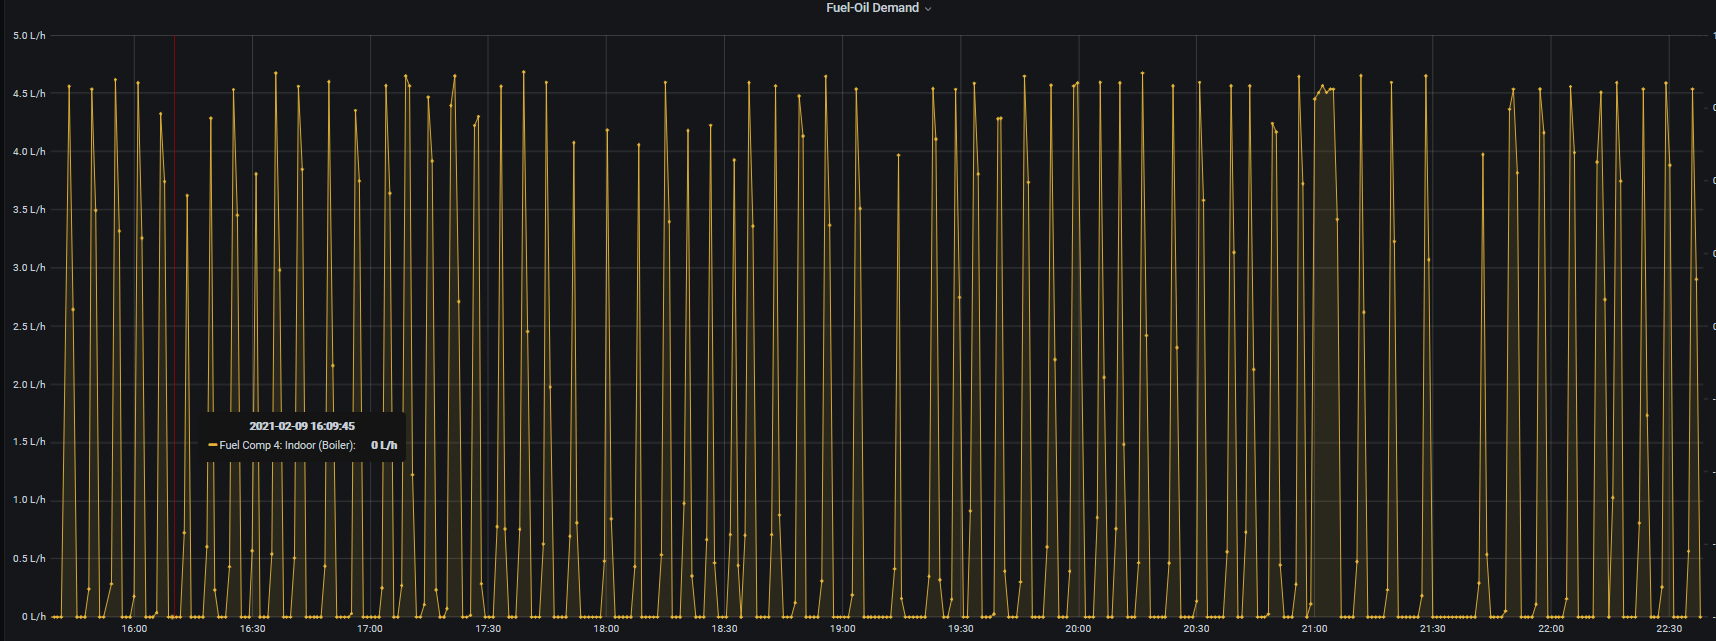
Notice that the pump is only on very briefly, about a minute at a time (except occasionally). We actually are checking with the HVAC engineers, because this looks like a broken control system – we think it should not be doing this. The variation in max flow is due to the fact that our totalizing sample rate (1/minute) is very close to the on/off cycle time so there’s a little bit of aliasing. The peak flow is 4.5 L/m, as compared to around 3.2 L/m at Comp 2.
Propane Raw Data
Let’s compare propane next. Here’s the data for propane use at Comp 2:
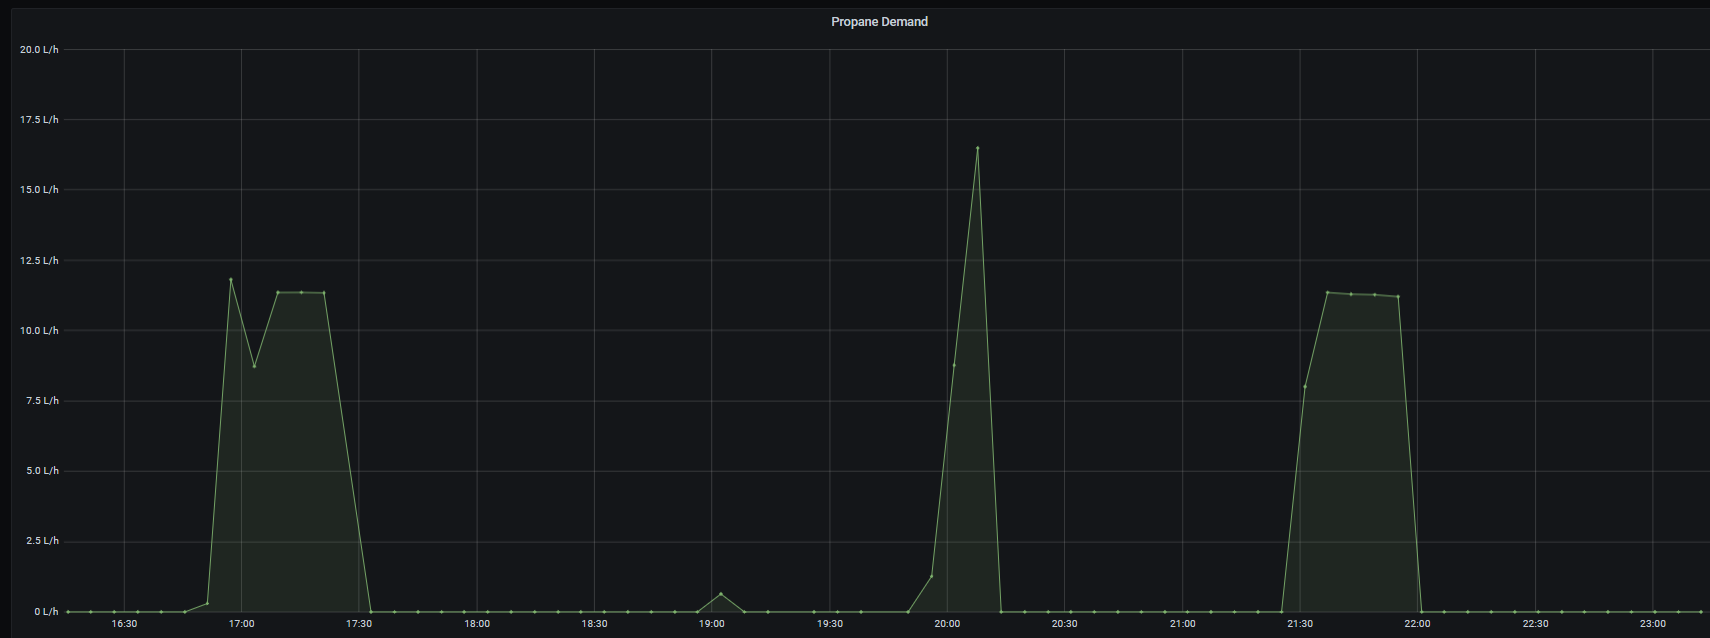
Propane rate of flow depends on what’s using the propane. We happen to know that the two short-but-broad pulses at 17:00 and 21:30 are domestic hot water; the tall, narrow spike at 20:0 is cooking, and the blip at 19:00 is the water heater maintaining temperature.
Comp 3 also uses propane:
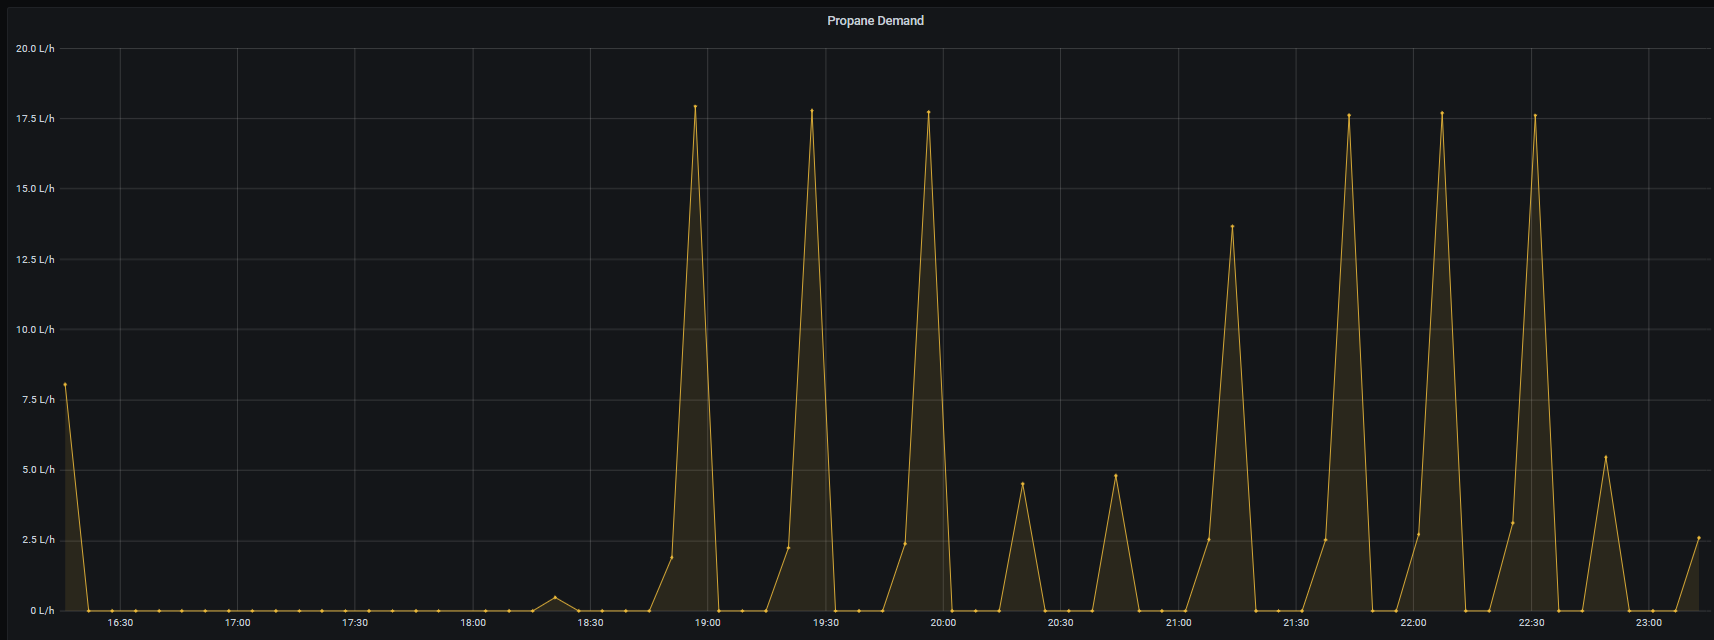
Note that the use pattern is spikier; the peaks are a little higher. It appears that the furnace is cycling two to three times per hour; this is as it should be.
Comparing Buildings: BTU/Sq Ft.
The data is interesting, but we’re really like to compare buildings of different kinds and sizes. To do this, we have to convert the different energy inputs to a common unit — we’ll use BTU, British Thermal Units. But then, since the buildings vary a lot in size, we need to normalize; all other things being equal, a larger building will use more energy than a small one. The Passive House community normalizes based on square feet of living area. Finally, we have to compare energy use over a consistent interval; let’s use a day.
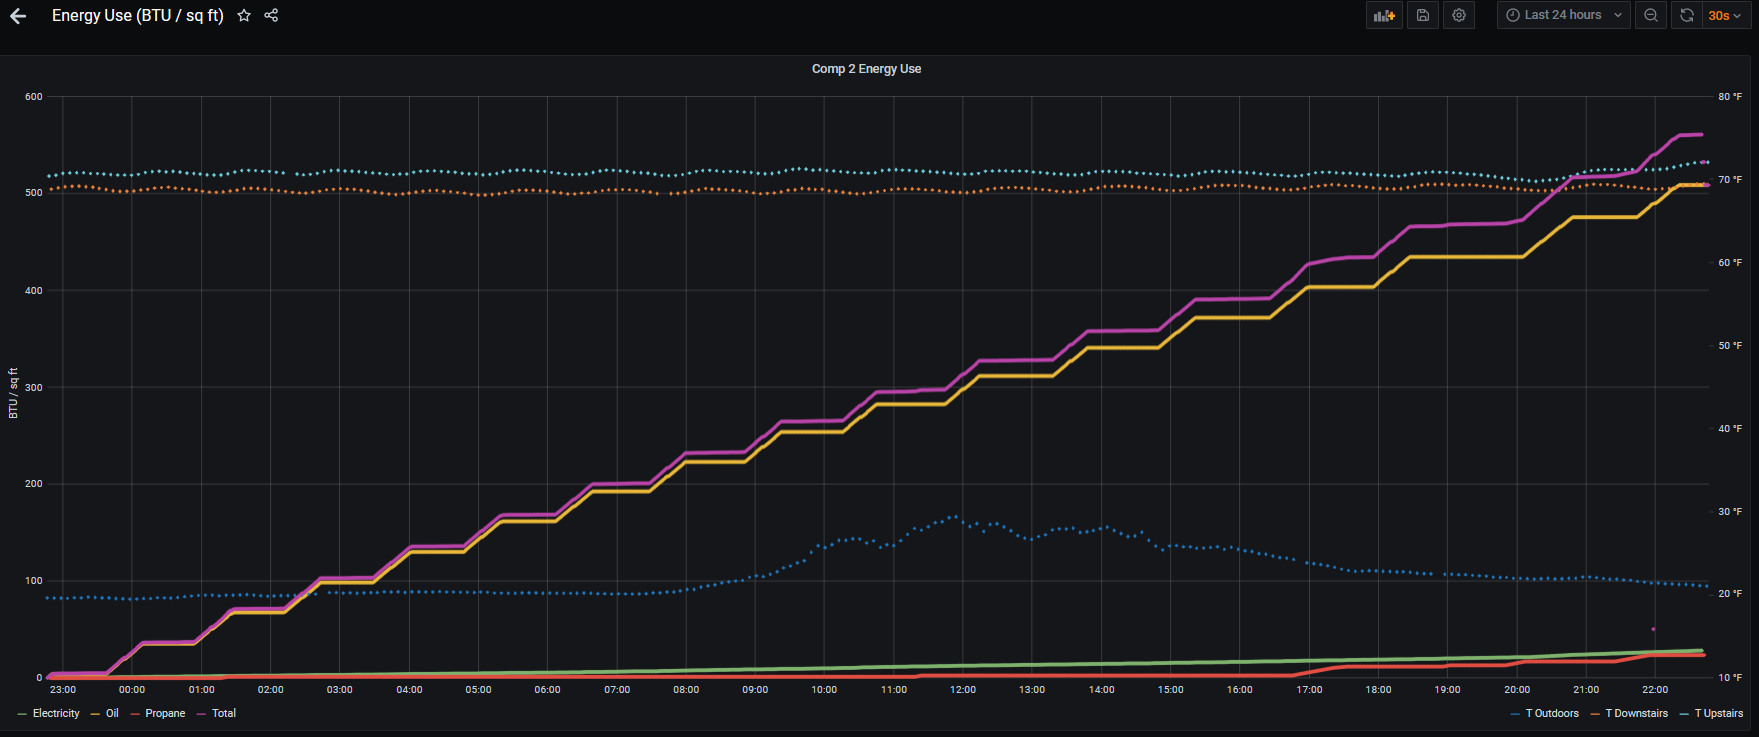
Let’s start with Comp 2, the 1847 farm house. This chart shows BTU/sq ft (the ramp), along with indoor/outdoor temperatures.

This chart sums propane, electricity, and fuel oil to give us the total BTU use, as the purple staircase. The building used about 550 BTU/sq ft on the day measured.
Let’s compare to Comp 4, the offices. In comparison to the old house, the offices are about twice as efficient:
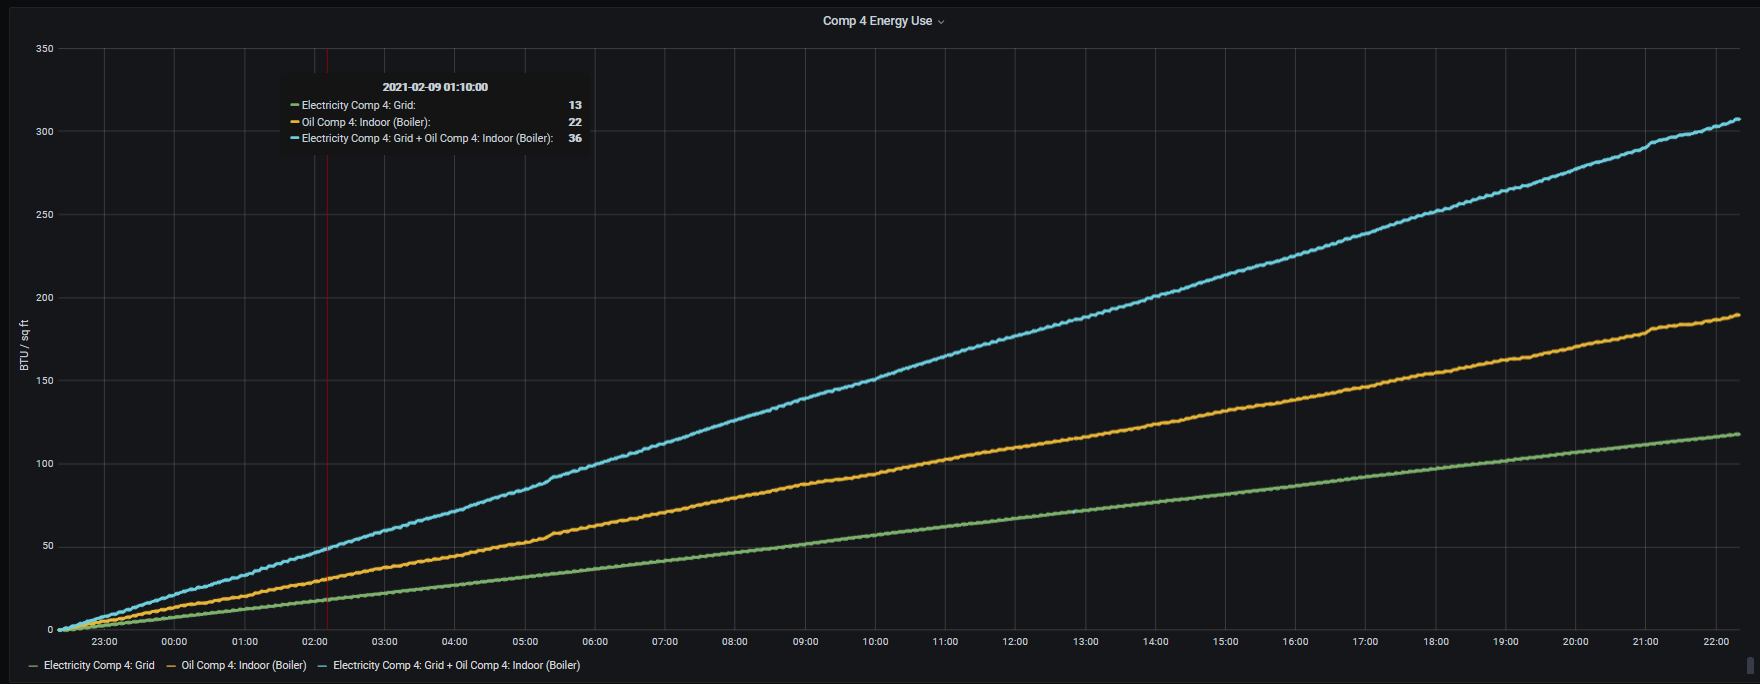
From the picture, you can see that the heat input from oil is relatively constant (unlike the farmhouse, where there’s a staircase effect as the burner cycles). You can also see that electricity is a major energy input — there’s a large server farm in the basement, and the waste heat is partially reused.
What about the 1970 bungalow?
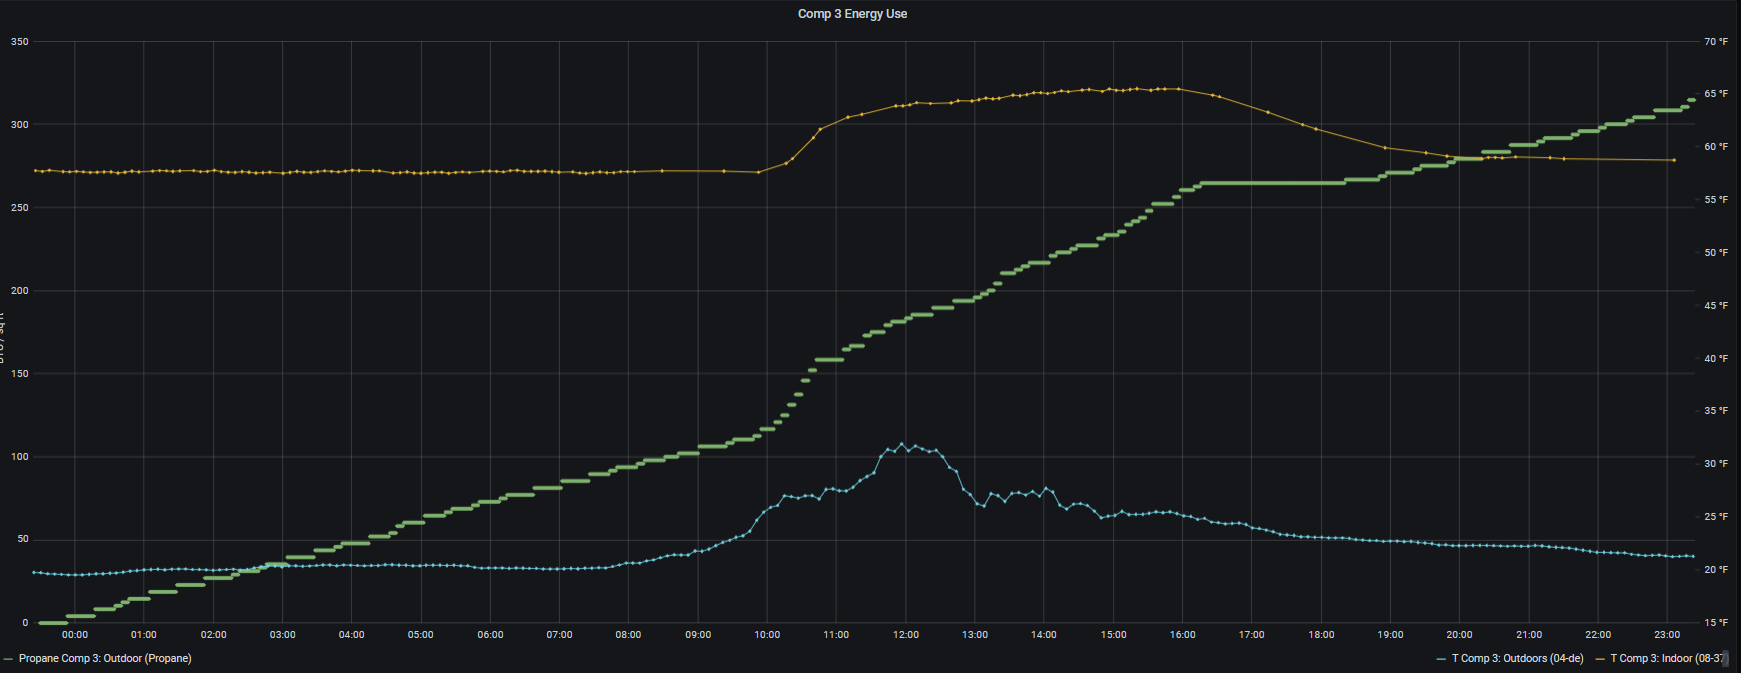
It’s actually just about the same as the office building. This is surprising, as the office building is tighter, has more modern buildings and is better insulated. However, some of the heat from the server room is being dumped out of the building; and the control system for the boiler is probably cycling too rapidly. We plan to study this to see if we can get some savings.
Finally, to give us some perspective, here’s the energy use from a Passive House constructed in 2013. This is an all-electric building. It has no solar hot water, so the energy use shown represents the quality of construction:
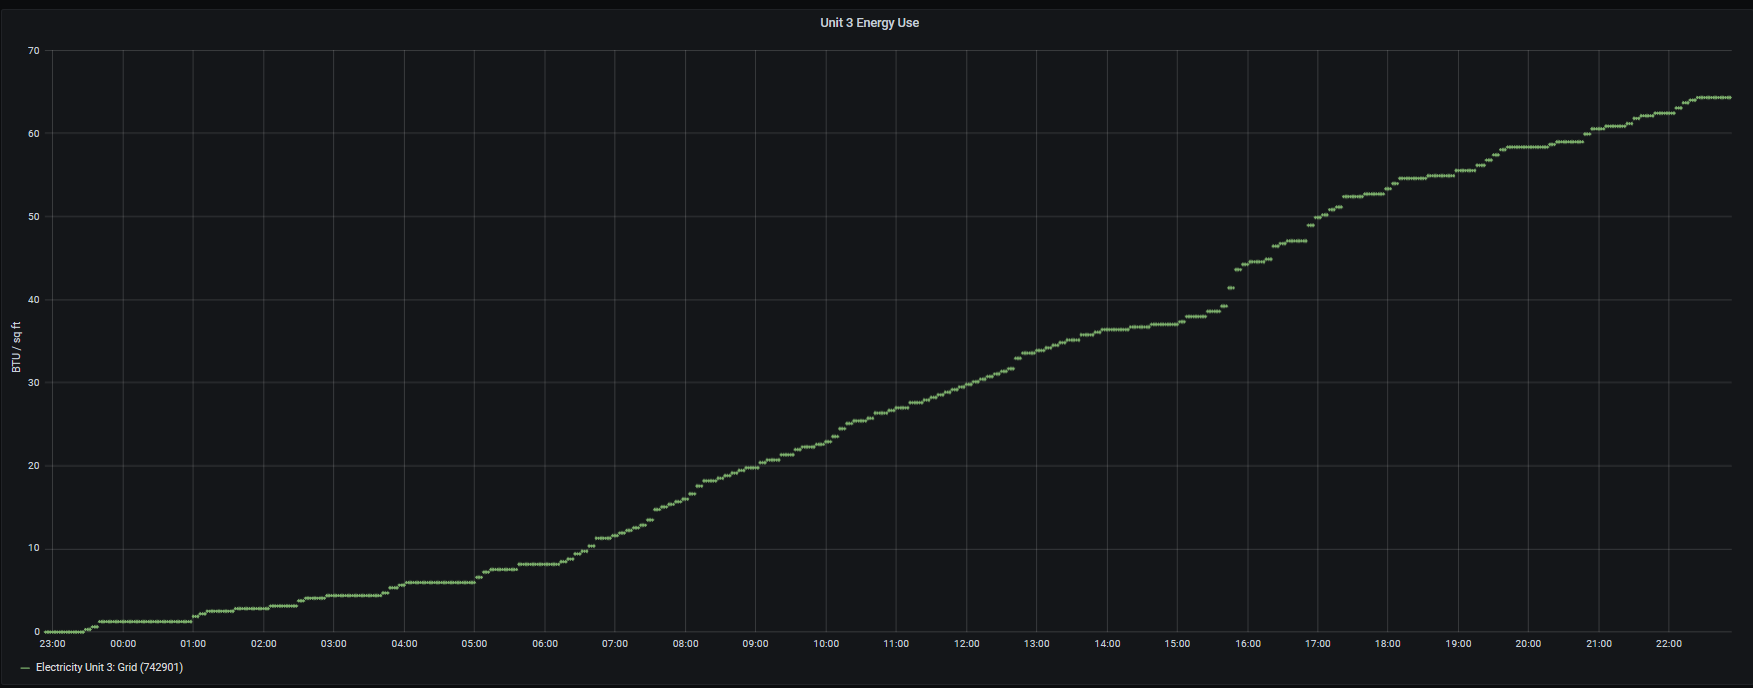
Unit 3 is only using 65 BTU/sq ft for this day. This means it’s five times more efficient than either Comp 3 or Comp 4, and more than eight times more efficient than Comp 2!
Conclusions
Here’s what we conclude:
- MCCI’s low-cost metering technology combined with LPWAN radio connections were, as expected, easy to install and trouble free. (We mention this because it still seems remarkable.)
- Comparing buildings based on energy intensity is a great way to discover actionable discrepancies.
- Comparing buildings based on energy intensity is a great way to demonstrate benefits of high performance construction techniques.
- Comparing buildings based on energy intensity is a great way to motivate building owners and maintenance staff to improve building performance, because it shows what’s possible.
- We need a cost-effective way to measure natural gas. Installing propane meters is simple; but due to regulatory issues and cosmetic issues, installing gas meters is not nearly as easy.
More Info
Information on the Model 4811 Electric Meter, the Model 4822 Indoor Environmental Sensor and the Model 4832 Outdoor Environmental Sensor can by found by following the links. The Model 4861 Propane Meter and Model 4871 Fuel Oil Meter are not yet on the website but are available by contacting us directly. Our open-source software is on GitHub.
Interested in monitoring building performance using MCCI’s NerveCircuit™ technology? Drop an email to sales@mcci.com, and we’ll set up an introductory discussion.
Updates
- 2021-06-14 added more details about comparables, corrected a few typos.